
GIS Data for Hurricanes: Updates for 2026
- Apr 9
- 3 min read
NOAA is continuing to expand and refine tropical cyclone forecast tools for 2026, with updates to the forecast cone, improved visualization of uncertainty, and new storm surge products for Hawaii. In this post, we break down what’s new for 2026 and how Adiabat helps organizations apply these updates to make better weather-driven decisions.
Why GIS Updates Matter for Hurricane Season 2025?
For the 2026 hurricane season, the National Hurricane Center (NHC) and National Weather Service (NWS) are introducing updates that improve how forecast uncertainty and storm impacts are communicated.
These changes continue a broader shift toward clearer, more spatially complete risk communication. From inland warnings embedded directly in forecast graphics to expanded storm surge guidance in Hawaii, the 2026 updates help users better understand where impacts may occur and how conditions may evolve.
What Changes to GIS Hurricane Forecasts are Expected?
New operational forecast cone with inland watches and warnings.
What's new: Inland tropical storm and hurricane watches and warnings are now fully integrated into the official forecast cone graphic. This applies to the continental United States, Hawaii, Puerto Rico, and the U.S. Virgin Islands.
Impact: This change improves how inland risk is communicated within one of the most widely used forecast products. By clearly showing inland alerts alongside the track, it supports earlier coordination and helps ensure that areas away from the coastline are included in planning and response.

An example of the 2026 version of the cone graphic for Hurricane Milton (2024) showing inland watches and warnings across Florida. image credit: NOAA National Hurricane Center.
Experimental cone graphic using ellipses.
What's new: An experimental version of the forecast cone uses ellipses instead of circles. These shapes better show how a storm may shift in direction and speed.
Impact: This provides a more realistic depiction of forecast uncertainty. The updated design helps users better understand how potential storm paths may shift over time, rather than interpreting the track as a uniform spread around a center line.
Expanded forecast error envelope.
What's new: The experimental cone expands to capture a larger share of historical forecast error, representing roughly 90% of past track variability.
Impact: The forecast cone will now show a wider range of possible paths. It helps reduce surprises and supports planning across larger areas.

New storm surge products for the Hawaiian Islands.
What's new: Storm surge guidance is expanding to Hawaii, including:
Storm Surge Watches and Warnings
Peak Storm Surge Forecast Graphics showing expected inundation ranges
Potential Storm Surge Flooding Maps based on the “P-Surge” model
Impact: These tools make coastal flood risk easier to understand in Hawaii. They support evacuation planning and help people see where flooding may occur.
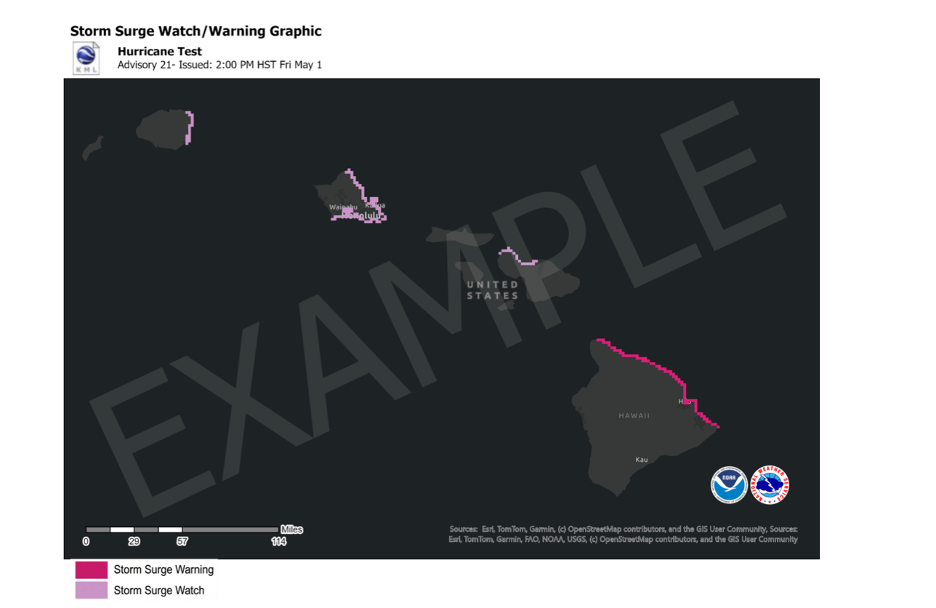
An example storm surge watch and warning for the Hawai’ian Islands, image credit: NOAA National Hurricane Center.
Continued improvements to cone interpretation and risk communication.
What's new: Updates to the cone graphic and related products continue to reinforce how forecast information should be interpreted, particularly the distinction between track uncertainty and the broader extent of storm impacts.
Impact: These improvements support more accurate use of forecast data and encourage consideration of complementary GIS datasets such as wind fields, storm surge maps, and rainfall forecasts to better understand potential impacts.
Preparing for Hurricane Season 2026 with GIS Data
With the National Hurricane Center continuing to enhance forecast products for 2026, including improved cone graphics and expanded storm surge guidance, the tools for understanding hurricane risk continue to evolve. But knowing a forecast exists isn’t the same as knowing what to do with it.
That’s where Adiabat comes in.
We help clients translate these complex data streams into clear, actionable insights tailored to their operations, assets, and decisions. Whether you're a transportation agency, utility, or private-sector risk team, our experts provide guidance with custom geospatial forecasts, scenario planning, and communication-ready graphics.
Oh hello, thank you for reading.
We are Adiabat, your go-to weather and geospatial professionals.
Data-driven. Independent. Woman-owned.


